The Challenge: Drowning in Data, Starving for Insight
Your marketing team is running brilliant campaigns across multiple platforms. But when you ask, “What’s working?” the answer is a scramble.
Sound familiar?
Your team spends hours—or days—manually exporting spreadsheets, cleaning data, and copy-pasting numbers into a report. By the time you get the answers, the data is already stale. You’re making critical budget decisions based on a lagging indicator, not a live pulse.
The problem isn’t a lack of data. It’s the lack of an automated system to turn that data into intelligence.
The Playbook: Build an Automated Insight Engine
You don’t need more spreadsheets. You need a better system.
This project delivers that system: a fully automated, end-to-end analytics pipeline that transforms raw campaign data from a chaotic mess into a real-time source of truth. It’s not just a dashboard; it’s a machine for clarity.
Here’s the framework that drives it.
1. The Automation Engine: The n8n Workflow
This is where the manual grind dies. We built a sophisticated orchestration layer using n8n to automate the entire data collection process.
- Connect to Anything: The system pulls data from multiple, disparate campaign platforms via their APIs.
- Scheduled & Smart: Workflows run on a schedule, automatically fetching new data, cleaning it, validating it, and handling errors with automated alerts.
- Resilient by Design: With built-in retry logic, the pipeline is designed to handle temporary API failures without manual intervention.
2. The Data Brain: The BigQuery Warehouse
This is where your data becomes intelligent. All the cleaned data flows into a central data warehouse in Google BigQuery, structured for one thing: speed.
- A Single Source of Truth: No more conflicting spreadsheets. All campaign data lives in one place, standardized and ready for analysis.
- Optimized for Performance: Using partitioned tables and optimized schemas, even complex queries across millions of rows return in seconds.
- Automated Transformations: Custom SQL scripts run automatically to aggregate data, calculate key metrics and prepare it for visualization.
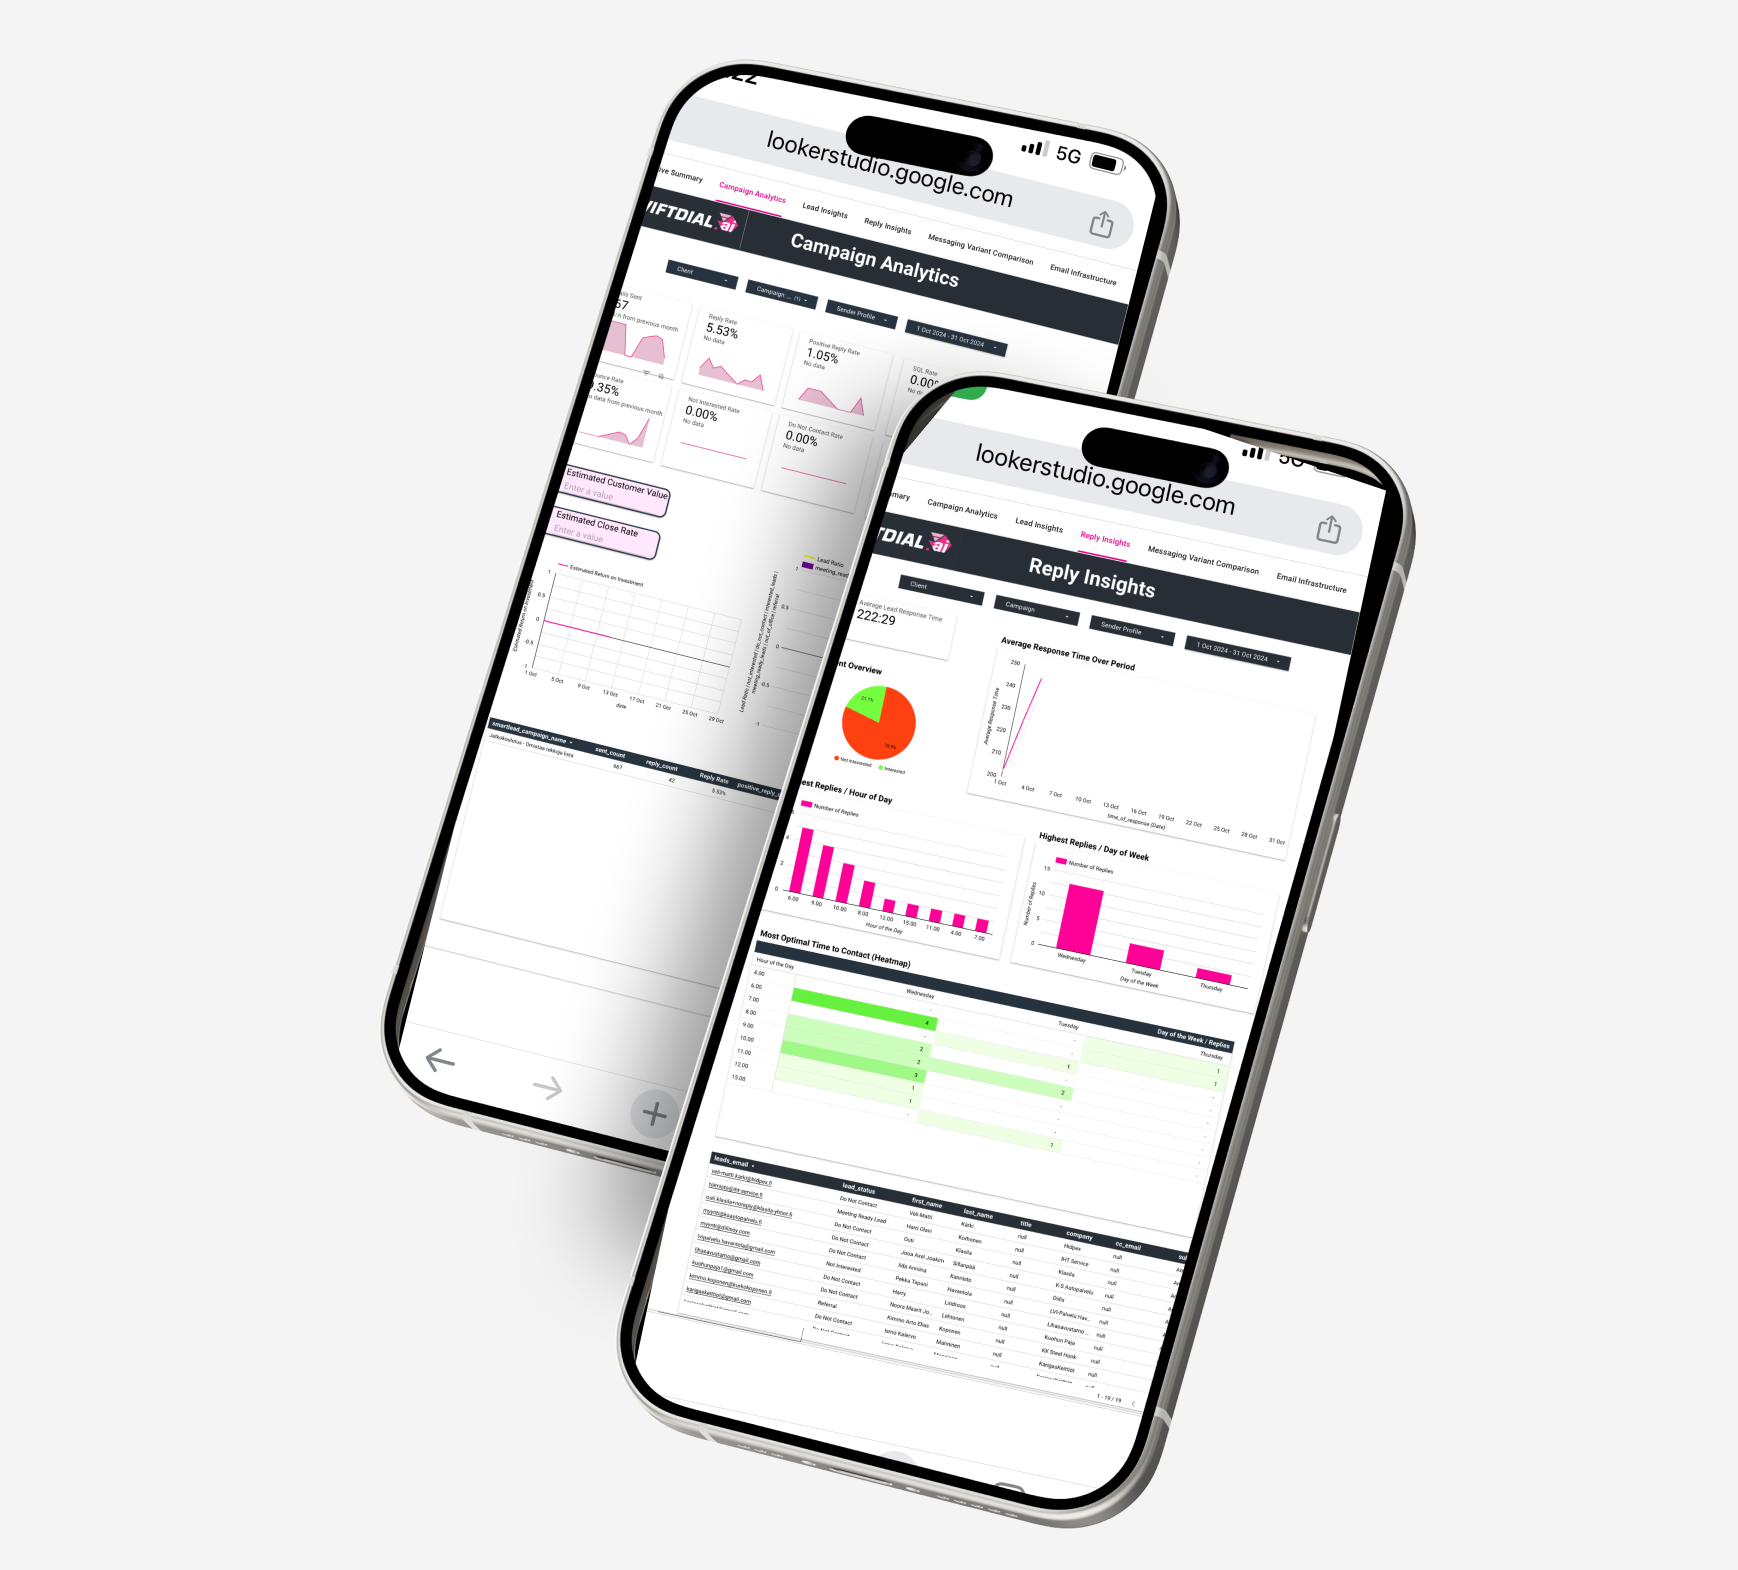
3. The Insight Cockpit: The Looker Studio Dashboard
This is where data becomes decisions. The BigQuery warehouse feeds a live, interactive dashboard in Looker Studio that anyone on the team can use.
- Real-Time Visibility: The dashboard is always on and always up-to-date. No more waiting for end-of-week reports.
- Interactive & Actionable: Team members can filter by campaign, drill down into specific metrics, and compare performance over time to spot trends as they happen.
- The Proof: This system delivered a 60% reduction in manual reporting time, freeing up the team to focus on strategy, not spreadsheets.
The Bottom Line
This project is the definitive playbook for any organization looking to escape the manual reporting trap. It proves that by combining modern, accessible tools like n8n, BigQuery, and Looker Studio, you can build an enterprise-grade analytics pipeline that delivers real-time insights and a significant return on investment.
It’s not about making prettier charts; it’s about making smarter, faster decisions.